Starting to Find the Story in Data
Behind every map and graph are countless data points and hours of data collection. When you add the time involved in compiling, formatting, and visualizing that data, the total effort towards a data summary can double. Therefore, in preparation for our largest data exploration experience to date, the entire ALLARM team got involved.
There are a number of steps that ALLARM takes to facilitate data interpretation with its volunteer community: 1) data verification; 2) data download and organization, including the development of statistical summaries; 3) GIS landscape mapping (land use, geology, stream designations, point dischargers, etc); 4) GIS watershed delineation to characterize the watershed draining into a site; 5) data visualization (graph making); and 6) data packet creation with site descriptions, statistics, graphs, and raw data. Given where Stream Team volunteers are in their scientific journey, 62 teams met the minimum criteria for data interpretation. As a result of the large volume of data, we had all hands-on deck to create site summaries and data visualizations for the 62 Stream Team sites. We compiled data for each of the Stream Team sites with at least one year of monitoring effort, and curated individual summaries into data packets by county.
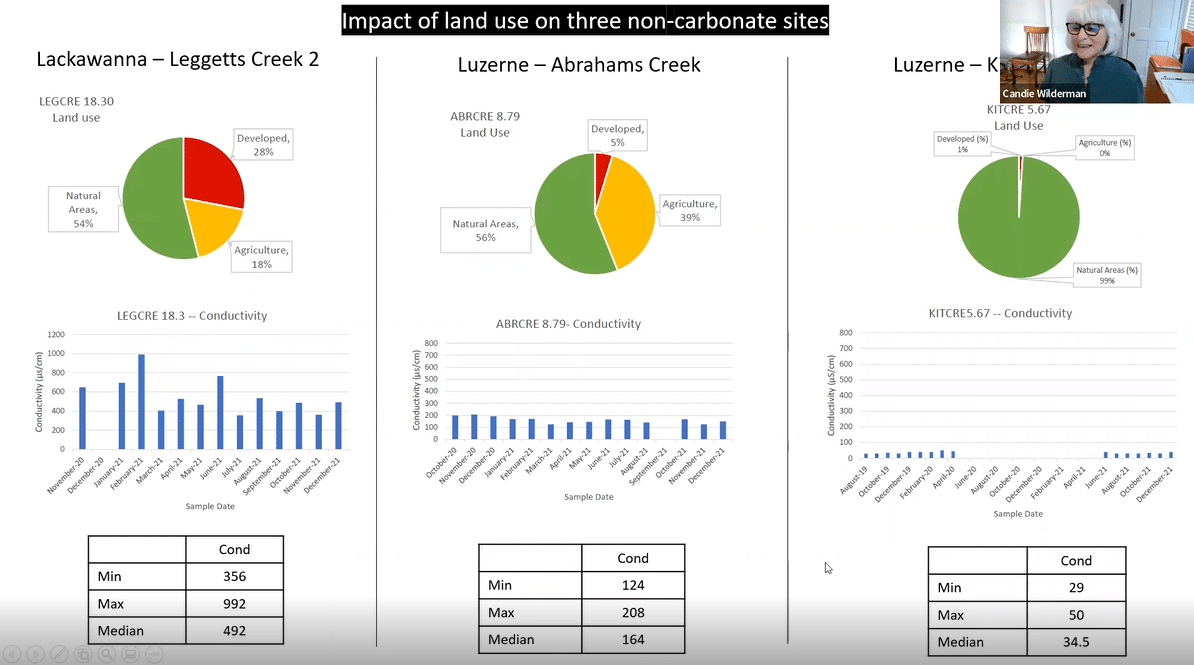
After Stream Team volunteers were sent their county packets, we hosted a Data Exploration meeting as the first step in the interpretation process. Together we walked through water quality influencers, state standards and policy, and how to utilize the packets for data interpretation. We look forward to seeing what stories and findings the volunteers begin to pull out of their data.
Learn more about water quality influencers and watch the data exploration meeting with Stream Team here: https://youtu.be/nAOaJb3NLHM?t=661.