Summarizing CBP Data on the Coverage of Chesapeake Monitoring
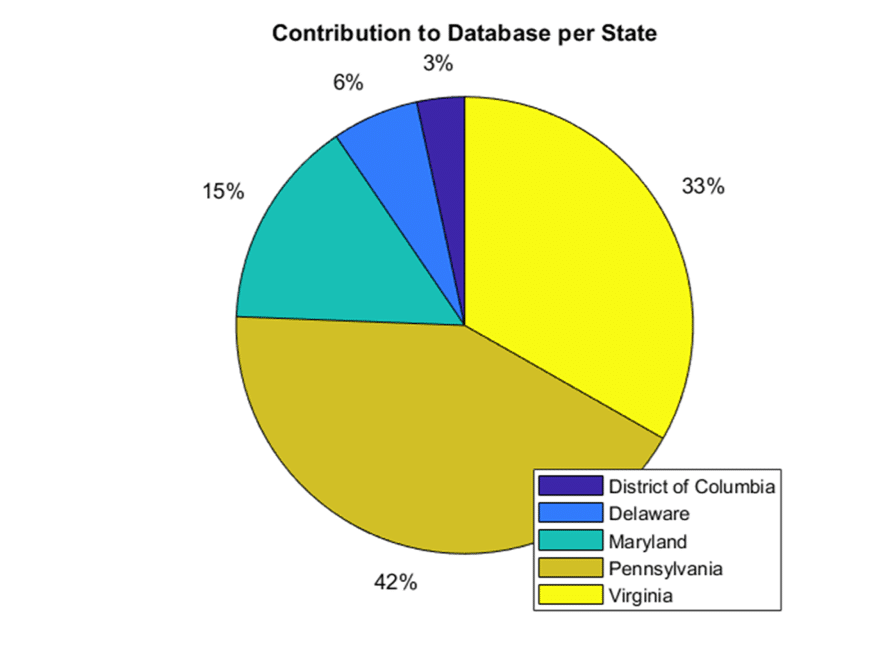
Dia Brown was a 2-month summer intern from the University of Vermont, working with the USEPA Chesapeake Bay Program Office and supported through the Chesapeake Research Consortium’s C-StREAM Program (Chesapeake Student Recruitment, Early Advisement and Mentoring). As part of her summer intern experience, Dia worked on exploring, characterizing and visualizing data available in the CMC’s Chesapeake Data Explorer. Dia showed us for example how data in the database represent conditions in 5 of 7 Chesapeake Bay watershed states. This result suggests we have large contributions of data from states along the shores of Chesapeake Bay plus significant data contributions from our largest watershed area, the Susquehanna river basin in Pennsylvania. Future outreach to New York and West Virginia groups can help improve data coverage for the whole watershed.

Figure 1. Data contributions by State across all water quality and benthic macroinvertebrate sampling represented in the Chesapeake Data Explorer as of August 2019 (Source, Dia Brown. C-Stream intern at USEPA, 2019).
Dia explored the data associated with a wide variety of water quality parameters in the Chesapeake Data Explorer representing sites in tidal waters of Chesapeake Bay and throughout the watershed nontidal streams and rivers. Looking specifically at one example, water temperature, she showed that data is being collected and submitted across all 3 Tiers of data uses (Figure 2). Tier 2 water temperature data – data suitable for targeting assessments for example, are the largest proportion of data presently available in the database. Tier 3 – regulatory level data – were the second most frequent water temperature results with Tier 1 – educational level use data – as the smallest number of temperature measurements available according to data tier.
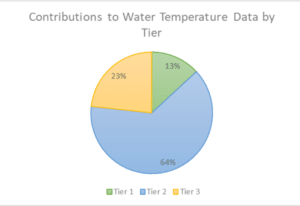
Figure 2. There were 8,872 entries for water temperature in the Chesapeake Data Explorer as of august 2019. Tier 2 water temperature data are the most common data by tier available in the database while significant amounts of data are available for Tier 1 and Tier 3 uses (Source: Dia Brown, C-Stream intern, August 2019).
Dia’s characterization of bacteria data collections in the database help show that groups are working to collect data yearround, across all four seasons (Figure 3). More data is being submitted for the spring and summer seasons than fall and winter at this time. Similar patterns in seasonal data representation were shown for water temperature.
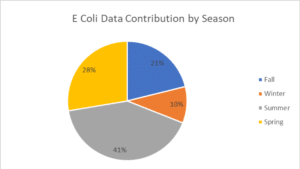
Figure 3. Bacteria data contributions by season across all years available in the Chesapeake Data Explorer, August 2019 (Source: Dia Brown, C-Stream volunteer, August 2019).
Work will continue by CMC in collaboration with Dia, other individuals and organizations to further explore, characterize, analyze and synthesize the growing richness of the Chesapeake Data Explorer.