Finding the Stories Behind the Data
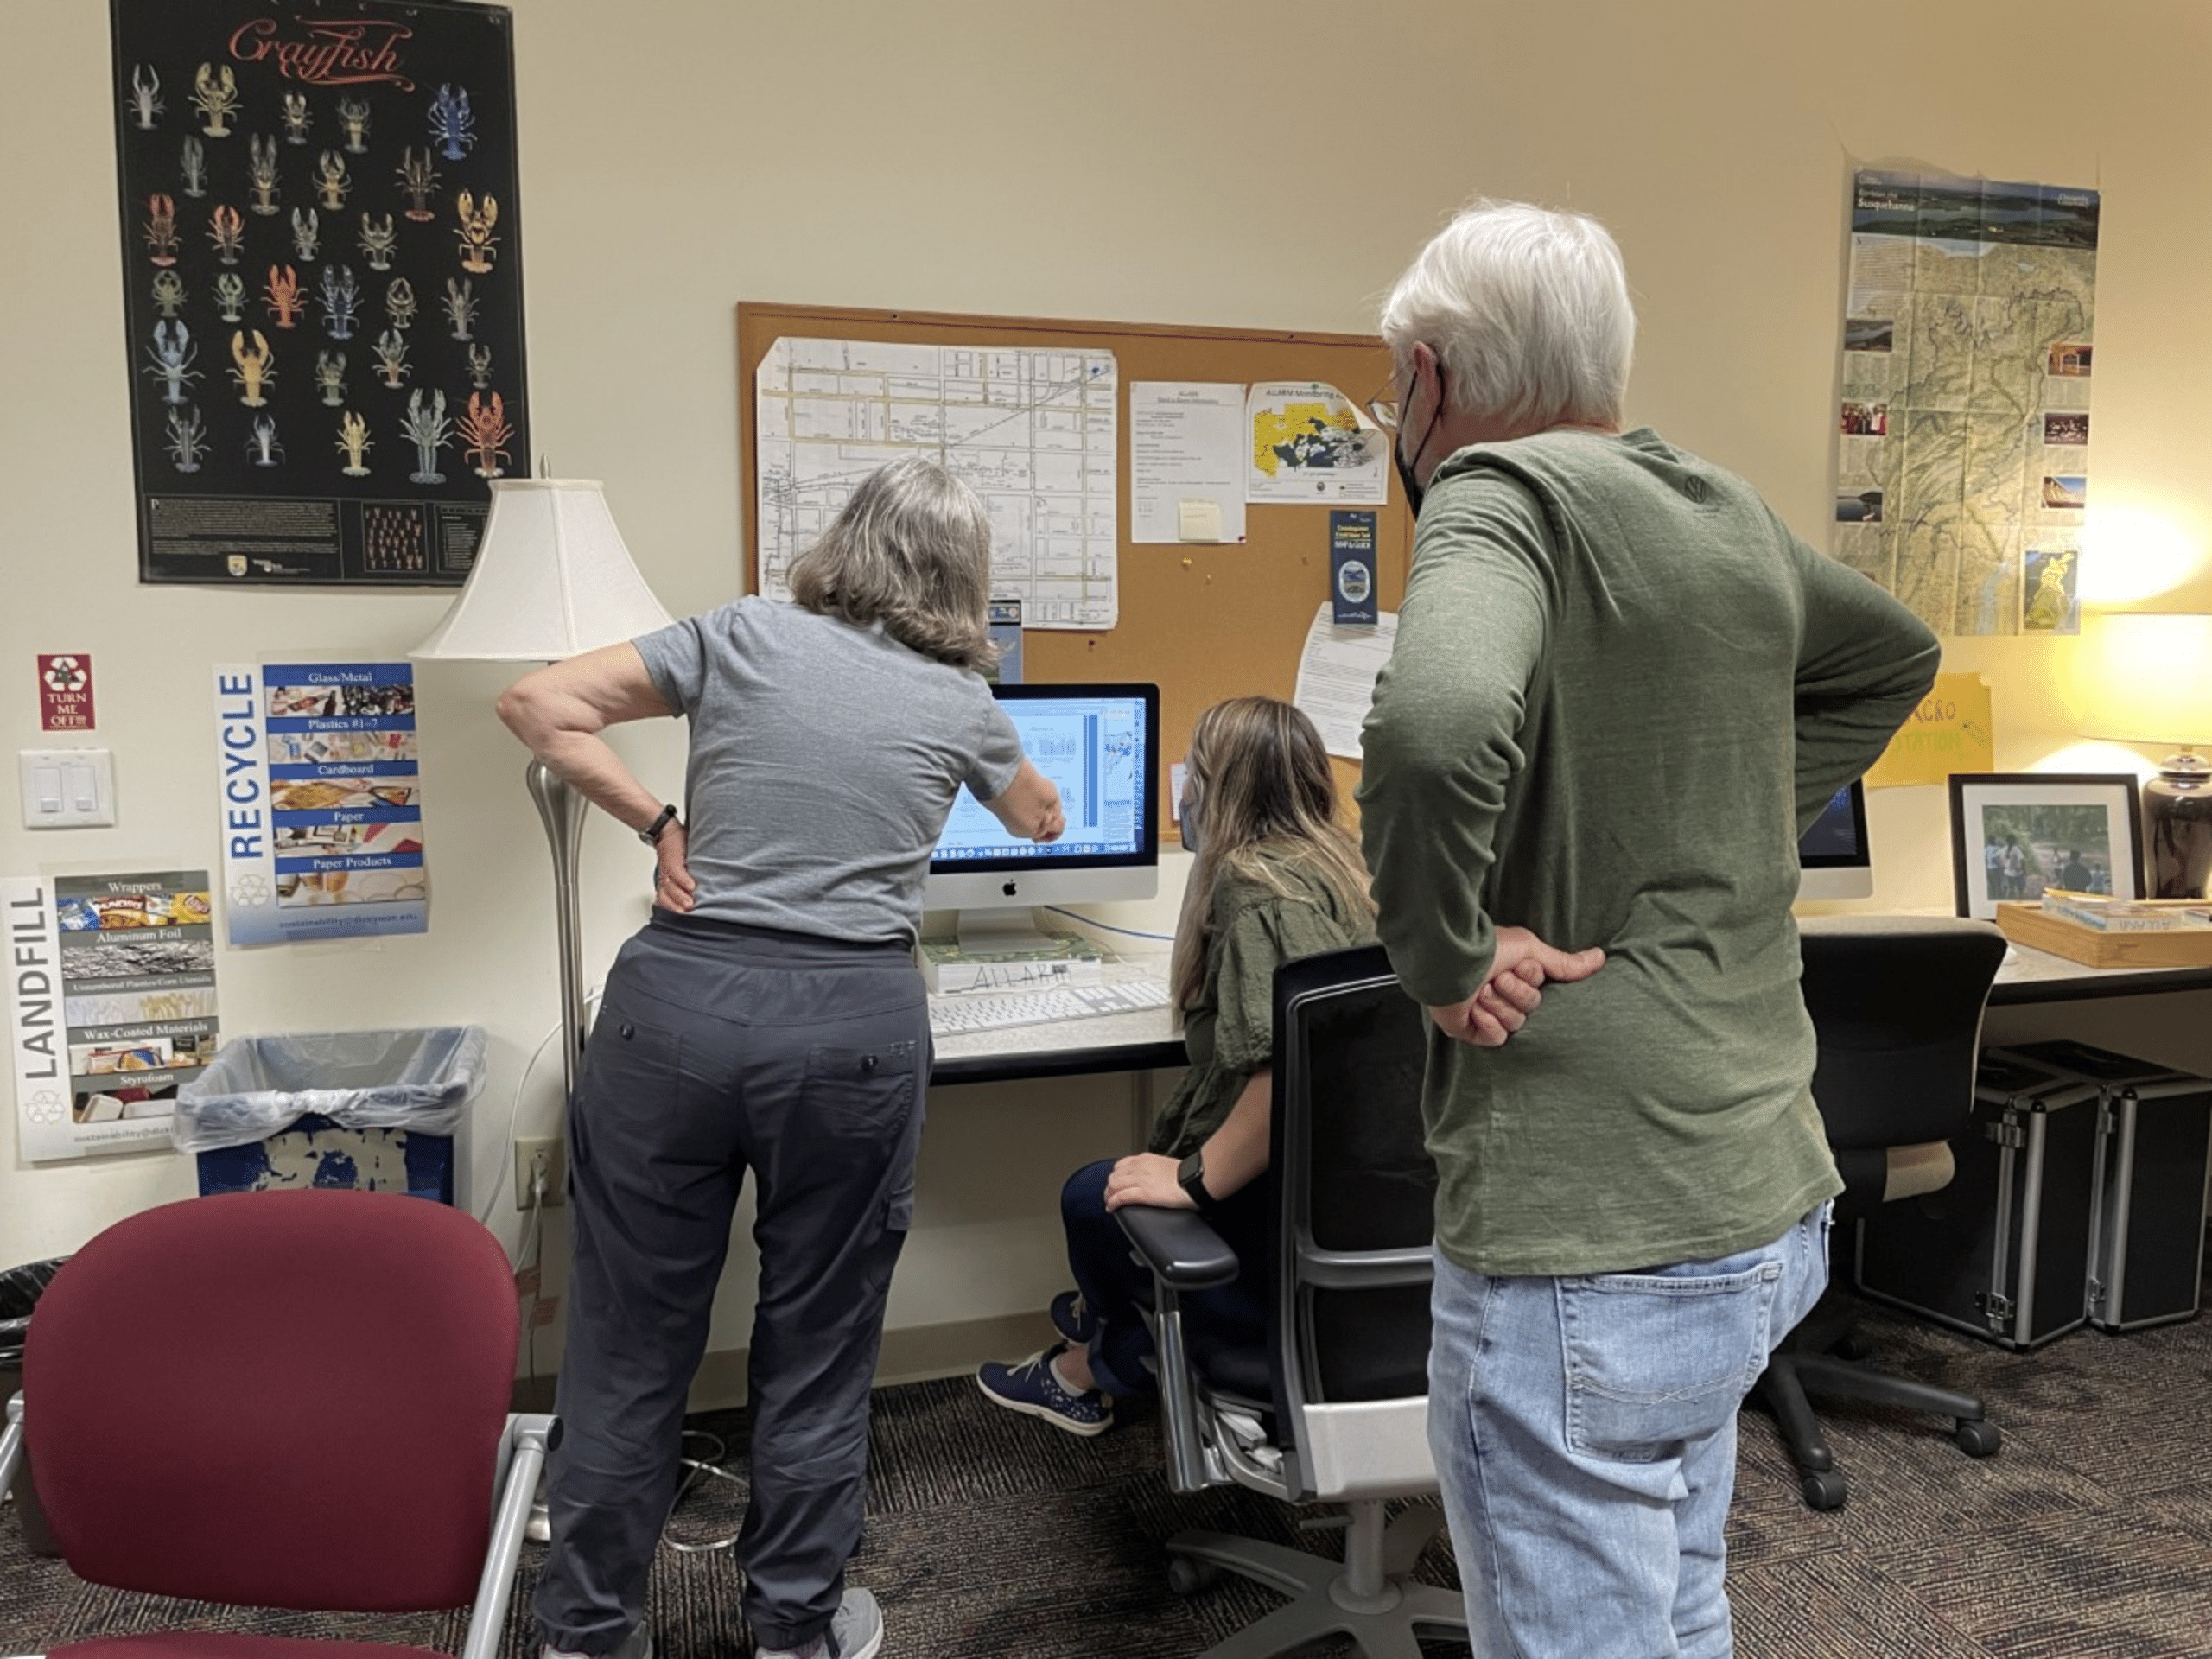
 ALLARM’s Stream Team volunteers have spent the past few months exploring the data they have collected, comparing the trends they identify with watershed characteristics, potential influencers, and state standards. On June 8th, we had 11 monitors present the stories they found.
After the data exploration meeting in April, volunteers were given a worksheet to guide them through thinking critically about site characteristics and data trends. For example, questions prompted them to think about how their values related to land use and geology, to examine any seasonal patterns, and to utilize their local knowledge to relate back to any weather events or land use changes they observed. ALLARM hosted data office hours over the span of a couple weeks to help guide them through this process and answer any questions.
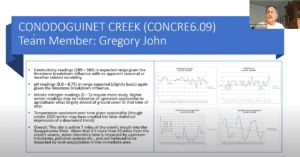
With all these pieces and their local knowledge to tie the story together, volunteers summarized their findings onto a PowerPoint presentation template and presented them in the first half of our Data Findings Meeting. Many included pictures they have taken of their stream and graphs or maps to help tell their story. In the second half of the meeting, Candie Wilderman (ALLARM’s Science Advisor) took us on a deep dive into the Stream Team dataset as a whole and presented some key takeaways. You can watch the recording of Candie’s interpretation here.